
 In my mass of emails from the government each day, every quarter I get one from FSIS letting me know what they’ve released their quarterly enforcement report. These reports detail actions taken against specific establishments, as well as details on how many enforcement-type actions are taking place ongoing.
I have a problem with this report however. It’s presented as a pdf with no metrics or historical data to put the information in context. FDA has done a good job in the past few years at releasing metadata in formats that allow analysis (CFSAN adverse event reports, inspection database, etc.), but USDA takes the time to kick out this report without showing what the trends are.
Alright raw data nerds, here at FF&F we’ve got your back. For all your analysis needs, we’ve collected a few of the more “top level” reporting numbers from reports going back to 2007, and put them all in excel for you to strip apart and analyze to your hearts content. We’ll even keep updating this spreadsheet and re-uploading every quarter ongoing.
fsis enforcement reports data (.xlsx)
Because some of us like bringing home a growler on a Friday night and entering data to do basic trending on government statistics, here are some of the trends I found interesting that aren’t visible by looking at any one of the individual reports, I’ll update these in the event that any new trends appear, the newest observations are posted first to keep the fresh content up top for you subscribers, the older ones are still relevant and listed below.
New! Total meat/poultry subject to standard re-inspection and refusal.

The overall lbs of meat/poultry product presented for routine re-inspection has remained high with no trend change, but new this year is a sharp increase in the number of lbs that were subject to additional inspection or outright refused. I’m guessing this is a direct result of FSIS implementing 100% inspection of Brazillian beef in May of this year and subsequently rejecting all beef from Brazil. In case you missed that, Food Safety News did an excellent job covering the JBS bribery scandal and tainted beef coming from Brazil.
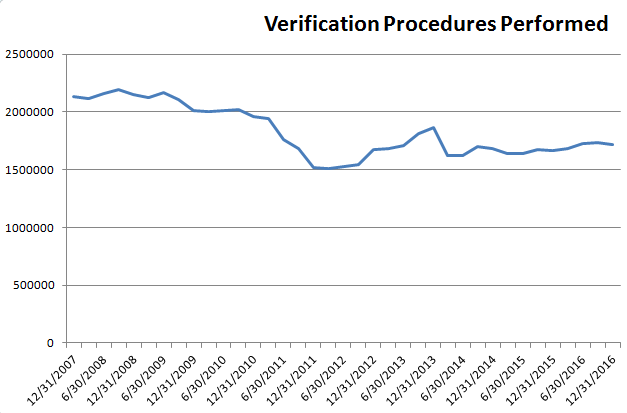
These are the number of individual verification procedures performed by FSIS inspectors each quarter. We can’t speak as to why there was such a change in 2010-2011, as these numbers could simply have started being calculated differently in the system. But NPR had some data to suggest that overall meat consumption started declining in 2010, which could lead to fewer establishments or approved inspection hours, and thus fewer verification events.

Compliance rates have always remained above 98% (meaning that 98% of all verification activities end with an inspector going “okay, you’re doing the right thing here”). But like overall verification, compliance seems to have a slight downward trend as well. It’s hard to say this decline is significant since the standard deviation of these percentage data is only 0.0016, but the whole point of getting this data organized to demonstrate the trend is to keep tabs on things like this. It’s hard to never have a downward trend when you hover near 100%, but it will be interesting to see if there is any FSMA effect in the next few years on this trend in either direction.

That 2% noncompliance rate is a count of Noncompliance Records (NR’s) that are issued. Per FSIS:
An NR is a written record that documents noncompliance with FSIS regulations. An NR notifies the establishment of the noncompliance and that it should take action to remedy the situation and prevent its recurrence. Noncompliance reported on NRs varies from non-food safety issues to serious breakdowns in food safety controls.
When an establishment fails a verification activity, it is issued an NR and has the option to appeal if they think an observation was out of context, the inspector was incorrect in his/her interpretation of the regulation, or some other circumstance led them to believe the finding was incorrect. The graph above shows that historically about 1/3 appeals are granted by regional offices/DC when establishments challenge an NR. But in recent years that number has dropped from around 35% to 30%. This could have also contributed to the increased number of noncompliances observed earlier, now that fewer appeals are being granted.

The poultry carcass inspection/condemn data didn’t have any interesting trends, it swung up and down without a lot of overall variation. The livestock carcass data was more interesting in that it seems to have a sustained downward trend. This could be to better herd health in the last decade or more efficient slaughter practices that result in fewer condemned carcasses from injury or contamination. While the cause is uncertain, as long as it isn’t the result of poor or inconsistent enforcement, this is a great trend! Fewer condemned animals is better for the animals and the environment.
I’m not sure this paints a completely accurate picture, but the data points were real, they actually wrote zeroes in the older reports. While the number of products imported has increased overall, this % refused trend shows that even though imports are increasing, we’re also rejecting more meat at the border than ever before. You can check out this FSIS directive to learn more about inspection of imported meat and poultry and what refusal criteria might be.
If you’re more intense than I am and want to do advanced statistics that excel can’t handle, you can see what’s out there in terms of software and let me know if you discover any new insights from this data! The spreadsheet and all graphs were created from source data in the FSIS quarterly enforcement reports.
![]()
USDA/FSIS (2017). Quarterly Enforcement Report for Quarter 1, Fiscal Year 2017 United States Department of Agriculture